Details Are Part of Our Difference
Embracing the Evidence at Anheuser-Busch – Mid 1980s
529 Best Practices
David Booth on How to Choose an Advisor
The One Minute Audio Clip You Need to Hear
Category: Philosophy
Play this Game
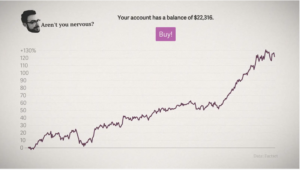
Timing the market can take on many different forms, but we’ve all done it at some point in our lives, even me. Sometimes the market is at an all-time high and we feel there is no way it can keep going up for much longer. We decide to wait for that market correction before investing. Sometimes there is turmoil in the world, markets are falling, and we want to wait to invest until that volatility subsides. In the moment, it always seems to feel obvious what the correct “market timing” strategy is.
Unfortunately, in the real world, timing the market is extremely difficult to do. As a firm of investment professionals, we recently tried to artificially time the market during a team Zoom…and we failed miserably. We used the website: Try to Time the Market to test ourselves. The website simulates a random 10-year historical return sequence from the US stock market. Over those ten years, you get one chance to sell and go to cash, and one chance to buy back into the market. You will beat the market return if you pick the right time to get out and get back in. Sounds easy, just sell when the market is at a high, and buy when it’s at a low.
As a firm, we only outperformed the market 40% of the time. Meaning 60% of the time, we would have been better off if we had just stayed invested the entire 10-year period. To make matters worse, when we did beat the market, it was only by a few percentage points, but when we lost to the market, it was usually by 50+%.
The game only takes a minute to play. Give it a few tries, and see how you fair. We’d love to hear how you did.
Why did we fail at trying to time the market? On average, the market goes up a few hundredths of a percent every day. This means that each day your money is out of the market you are losing out on that potential gain. If the market actually went up a tiny bit every day, no one would ever think to try and time it. However, the volatility of the market makes trying to time it so enticing. If you just avoid some of those bad days, months, or years, it can make a drastic difference in your net wealth. The trouble is if you miss out on those great days, months, or years, it can also make a drastic difference in your net wealth. Given, on average, that the market goes up every day, you are better off not trying to play the timing game and simply stay invested.
You’re better off taking the long view.
The Greatest Double
This month we have one item we are sharing. It’s that important and that good. How do I know? At Hill Investment Group, we’ve been doing a series of morning Zoom calls for a few years now, and this piece from our own Charles Kafoglis is viewed as one of the best we’ve ever had. Charles won’t tell you this because he’s too humble, but his five-minute video is something everyone should see.
Why? It frames the magic of compounding in an easier way to digest and incorporate into your own life. Whether you are building towards financial independence or already there, I encourage you to watch our natural teacher, Charles Kafoglis, and his talk on “The Greatest Double.”
Summary of Topics:
- Example of doubling from one of Charles’s favorite teachers
- What it looks like to double every ten years
- Phases of life – learn, earn, adjourn
- The impact of the last double
- Do you have 3, 4, or more doubles?
2022 Investment Performance

It’s no secret that 2022 was challenging for both the stock and bond markets. Stocks ended the year down 18%*, while bonds were down 13%**. How did we do in 2022? Thanks to our compliance group, all we can say here is that our strategy of investing in low-cost, diversified strategies that tilt toward small, value, more profitable stocks meaningfully outperformed the S&P500 index in 2022.
As much as I would like to pat our firm on the back, you know our refrain: one year is essentially meaningless when it comes to investing. Due to the volatility and randomness of markets, any strategy can outperform or underperform in any given year. Our strategy certainly does not outperform every year and can even underperform several years in a row. To have real confidence in an investment strategy’s reliability, investors must look at how it performs over decades, not just years.
To see how we measure up over the long haul, we go back as far as we can, looking at the investments we recommended each year (and own ourselves) to see how our philosophy has held up over time. Our favorite chart compares the value of a hypothetical $1 invested in the year 2000 to 2022. Some of you may be familiar with Paul Harvey’s famous line regarding “the rest of the story.” Shoot me a note at zenz@hillinvestmentgroup.com for the details and the rest of the returns story. We can share how our recommended equity strategy has performed over time and the magnitude of the benefit of taking the long view.
If you have been a client for a while, you have likely seen the benefit of a long-term, evidence-based strategy show up in your portfolio. If you’re not a client, ask yourself why. Then pick up the phone and call us. You can schedule a call with me anytime here.