Details Are Part of Our Difference
Embracing the Evidence at Anheuser-Busch – Mid 1980s
529 Best Practices
David Booth on How to Choose an Advisor
The One Minute Audio Clip You Need to Hear
Category: Philosophy
Why Diversify Globally?

As an investor, it’s natural to be drawn to invest in your “home” market. The United States is where you live and work. You know the companies, politics, and economic climate. It also doesn’t hurt that the returns of the U.S. market have been fantastic over the last decade. From 2010-2022 the S&P 500 has returned an average of 12% annually.
In comparison, over the same period, the MSCI All Country ex US index, representing global stocks excluding the US, returned an average of 3.5% annually. These figures might lead one to question the need for global diversification. I’m here to convince you that diversification is, in fact, “the only free lunch” in investing.
History has demonstrated the importance of looking beyond recent performance and that any country, even successfully developed ones, can have long periods of sustained underperformance.
For example, let’s start by looking at the United States for the decade directly before the one mentioned above. From 2000-2009, known as “the lost decade,” the S&P500 had an annualized return of -1%, while the MSCI World ex US index had an annualized return of 1.6%. Over this decade, investors lost money by investing in the US stock market and had 27% less money than an investor who invested in global ex-US equities.
Another example is Japan. In 1989, Japan held the title of the world’s largest stock market. With a total market cap of approximately $4 trillion USD, iconic companies like Toyota, Sony, and Honda were global industry leaders. Japan had a diversified economy and was widely regarded as the world’s technology hub. During the 1980s, the Japanese market grew from $0.5 trillion to $4 trillion, with the Nikkei (Japan’s equivalent of the S&P 500) delivering impressive annual returns of 19.5% from 1980 to 1989. At that time, the US stock market’s size was smaller than that of Japan at around $3 trillion.
However, fast forward 35 years, and the picture looks starkly different. Today, the US market is valued at a staggering $40 trillion, while the Japanese market lags behind at approximately $5 trillion USD. Notably, Japan experienced no runaway inflation, wars, political turmoil, social unrest, or famine during this period. Despite its once fast-growing market and technological prominence, the Nikkei grew by less than 1% annually over the next 35 years. This is a powerful reminder that even the most promising markets can encounter prolonged stagnation.
The tale of Japan’s rise and subsequent stagnation highlights the importance of global diversification. While recent US market returns have been remarkable, investors must consider the broader global landscape and the potential risks of concentrating investments solely in one country. By embracing global diversification, investors manage risk, gain exposure to diverse opportunities, and position themselves to capture long-term growth potential. A well-diversified portfolio provides resilience, protects against overexposure to a single market, and helps navigate the uncertainties of the global economy.
This information is educational and does not intend to make an offer for the sale of any specific securities, investments, or strategies. Returns and market information quoted here was pulled from publicly-available, third-party sources believed to be accurate. Investments involve risk and, past performance is not indicative of future performance. Any actual return will be reduced by advisory fees and any other expenses incurred in the management of a client’s account. Consult with a qualified financial adviser before implementing any investment strategy.
The Path to Greater Returns
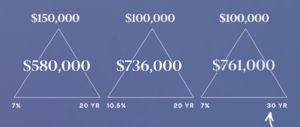
Charles Kafoglis leads our Hillfolio segment and produced a stellar educational resource recently titled “The Greatest Double“. Many clients connected with the message of the importance of time to the patient investor. Charles is back with a new gem called “The Path to Greater Returns”, a compelling story that extends our understanding beyond time and seeks to prove that your investment rate of return is just as important.
If you find these videos valuable, please let us know. Feel free to share this email and video with a colleague, friend, or serious saver.
You can contact us directly at Charles@HillInvestmentGroup.com or 314-448-4023 if you want to talk about your plan in more detail.
The Power of Staying Put
 It’s no secret we love Morgan Housel. We reference him time and time again because everything he says is spot on. If you don’t know, he has a new podcast and we’re enjoying hearing Morgan every bit as much as we love reading him. In the episode “The Power of Staying Put,” Morgan says, “There are so many times in life where what you do is less important than how long you’ve been doing it for.” It sounds a lot like taking the long view.


